A simple, text-based timeline visualisation tool.
It was born from the realization of my difficulty to put events and phases of my past into context. Chronicle is an attempt to collect, store and visualize this information in a single place and make it easily accessible.
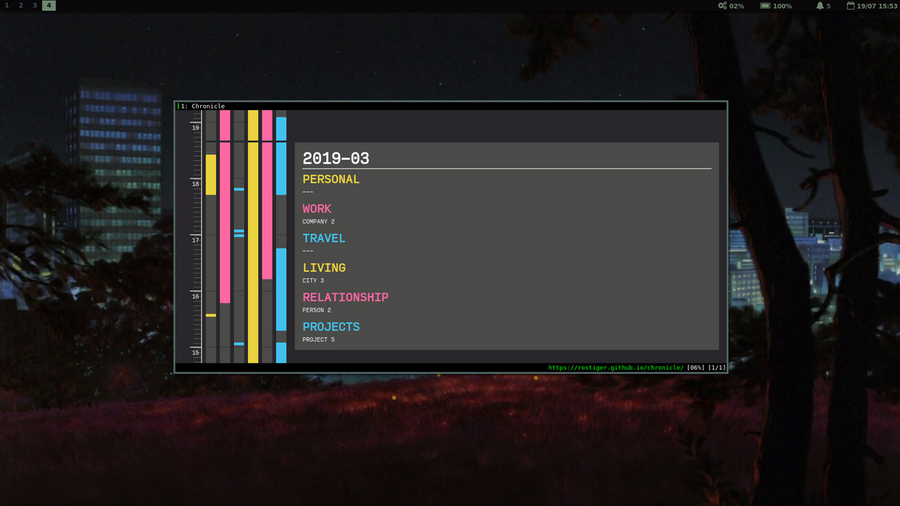
Chronicle creates a timeline with multiple vertical lanes from text based data using the Tablatal and Indental formats and parsers.
Each lane represents one of the categories in the details panel on the right. The black bar at the top displays the current year and month. Chronicle supports singular, continuous and ongoing events.
The data is stored in database/chronicle.tbtl and uses the following format:
FROM     TO       CAT DESCRIPTION
2018 APR 2019 SEP ID  Event Description
The tab CAT represents a category that must be defined in database/settings.nbtl
CATEGORIES
ID
NAME : TITLE
COLOR : #HEXCODE
A single month is currently the smallest time unit Chronicle supports. Singular events can be added by omiting the TO parameter:
FROM     TO       CAT DESCRIPTION
2018 APR ---- --- PRO Event Description
Ongoing events can be declared by adding an asterisk at the beginning of the TO parameter:
FROM     TO       CAT DESCRIPTION
2018 APR *--- --- PRO Event Description
Links
incoming(1) | reviews2020